
David Topps, Corey Wirun, Rachel Ellaway
In exploring some of the concepts around Directed Acyclic Graphs and OLab in the assessment of clinical decision making, we have been juggling the ideas around layered and interconnected DAGs. Some of these explorations led us to the concept of heterogeneous graphs and this excellent article: https://www.amazon.science/blog/how-aws-uses-graph-neural-networks-to-meet-customer-needs
Homogeneous and heterogeneous graphs
In homogeneous graphs, the nodes and links are of the same type. While they might each have different parameters or attributes, they are consistent in representing the same things. For example, in OLab4, our DAG consists of Nodes and Links: while Nodes will have different Counters, Titles, content and pathway parameters such as Root Node | End Node | Must Avoid | Must Visit, they still represent the same type of entity. Similarly Links represent the edge between two Nodes – they may have different parameters such as Hidden, Label, but they all function in the same way.
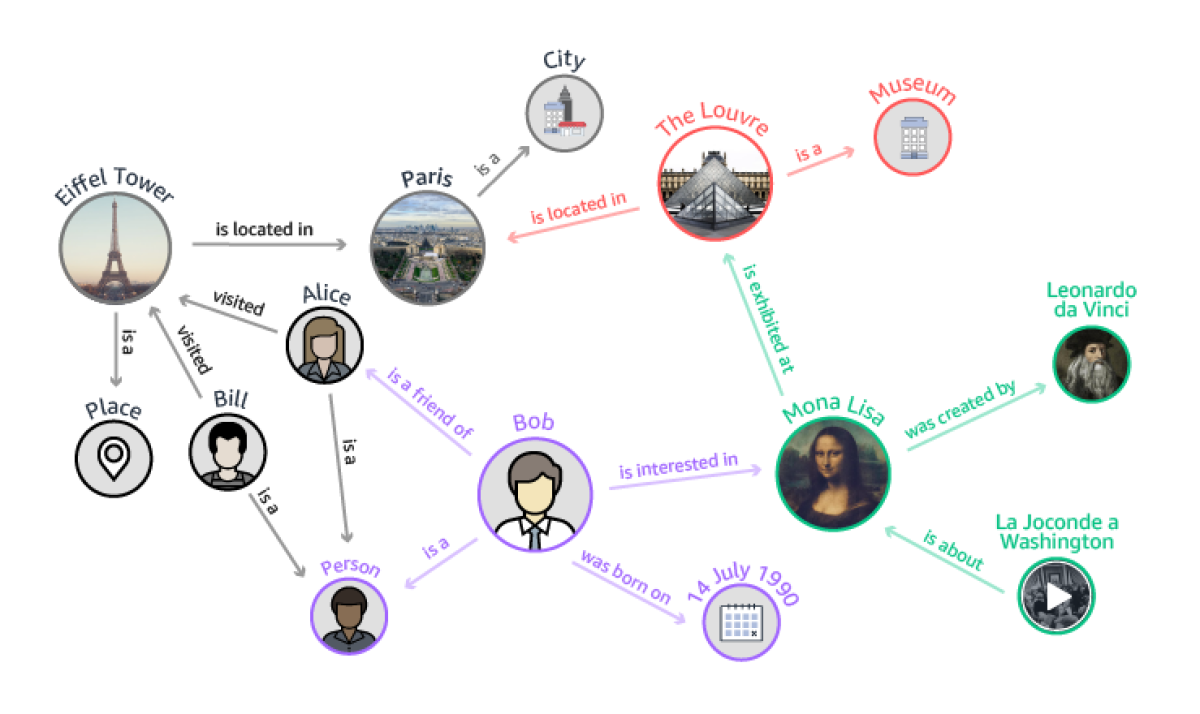
There may be some advantage to considering the use of heterogeneous graphs, illustrated in this excellent article by Labonne on Graph Attention Networks. They still have nodes and edges but the nodes can represent different objects or entities. Similarly, you can have different types of edges. This is not necessary for the basic function of OLab but it may have some advantages when you want to examine the connections and pathways between different entity types being explored in clinical decision-making.
For example, Counters in OLab: these are Scoped Objects. This means that they can be attached to Nodes across many different Maps – this is new in OLab4; in OLab3, Counters were only attached to a single Map. Counters can have different data types: while they are most commonly integers, they can also be strings or floats.
In tracking some of the decision factors in our TADAM project, Counters will be used to parameterize those factors by asking clinicians to weight their importance or influence on the decision being made. As such, there will be a lumping/splitting normative process for each Map but there will also be considerable commonality across Maps, as demonstrated already in early polling of clinicians about the 12 decision examples in ‘Case Factors and Decision Making’.
Counters can be connected to Nodes, Questions, and Rules/Scripts. As such, they can be thought of as another node type with edges connecting them to those other object types. The same applies to Constants, Questions and Files – all of these are also Scoped Objects in OLab4. So they each can also be Node types in a heterogeneous graph. At this point, that possibility has less obvious applicability to TADAM but the concept should not be forgotten in case it has later utility.
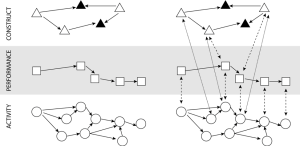
In the OLab Session Reports, we also generate DAGs, as noted in Figure 5 in https://olab.ca/using-directed-acyclic-graphs-in-olab/ — the performance layer DAG consists of timestamped Node visits, responses to Questions, and changes in Counters. In Figure 5, this is represented as a linked but separate homogeneous graph. It could be incorporated into a heterogenous graph along with the main Map graph.
Using Graph Neural Networks for DAG path analysis
In our initial TADAM approach, we describe the possibility of using methods such as Structural Causal Modeling to evaluate the goodness of fit between the candidate’s pathway and the range of pathways expressed by the reference (expert or near-peer) group. For simpler cases, that will be sufficient but for more complex cases, we will need to introduce a greater level of analytical sophistication in assessing our pathways.
Since the performance graphs represented by our Session Reports can be considered as time series, it may be feasible to use recurrent neural networks (RNNs) which are designed to handle sequential data. However, the use of graph neural networks (GNNs) holds more promise in the flexibility of approach and more likely to be useful in exploring how the various factors impinge on the decision-making process of a clinician.
As noted in the article, there are various levels of tasks that can be employed in the GNN. Of particular importance to TADAM will be the use of graph-level tasks which are useful in the analysis of collections of small independent graphs, such as our case Maps. This approach will enable us to look at, not just how a candidate performs on a single case (Map) or decision (Node), but also across a range of cases ie. being able to discriminate across the entire exam. Ultimately, this is what really matters: all clinicians will differ to a small extent in how to handle a particular case – there are standard and nonstandard ways to fix a problem. A poor or aberrant candidate may have a pattern of maladaptive behaviors and decisions that are not consistent with the standard of care, and this will show up in such graph-level task analysis.
Link-level task analysis will be useful in a different aspect of TADAM. This approach examines the parameters of a Node or, in a heterogeneous graph, the Counters entity-type. It is a useful tool for predicting or discovering previously unrecognized connections between nodes. We will be able to use such link-level task analysis to help refine the decision factors that are specified and quantified by our clinician groups as they provide weightings to their case factors (described in ‘Case Factors and Decision Making’ above).
Beyond Clinical Decision Making
The whole approach of using GNNs and graph-level task analysis has huge potential. We have previously discussed the debates around how clinicians solve a problem and the efforts over the past two decades to dissuade medical students from using heuristics; that algorithms are the best way to solve a problem, despite ample evidence that all clinicians use heuristics for the vast majority of their decisions.
What has been lacking is a way to explore and assess heuristic and algorithmic pathways, to compare their merits and utility. This whole area can now be opened up by using GNNs and graph-level task analysis to explore some of these real world decision trees.
It is also important to remember that what we are really looking for here is not the perfect pathway or decision set. There are many paths that are all reasonably acceptable. What we are concerned about is fundamental to the Hippocratic Oath: primum non nocere. We want to be able to detect and discriminate (in both senses of the word?) aberrant behaviours: clinicians whose activities and decisions are not consistent with a general standard of care. This is a huge concern for the Medical Regulatory Authorities (MRAs) and licensing bodies in all health professions.
At this point, we should also note our previous work looking at the potential use of graph databases as a means of detecting aberrant physician behaviour. While some may see this as an invasion of privacy, this is easily countered by several observations: (1) Google does it; (2) the license to practise is a privilege, not a right; (3) the public good outweighs the private interest.
In our glib comment about Google, we refer to the ubiquitous practice of large corporations such as Google, Amazon et al in tracking our personal information. Despite such measures as GDPR, the use of personal information continues to drive much of their industry. Remember the Pigs in a Barn?
Remember that, when everything is free, you are not the customer, you are the product.
We also know that simple external data can act as useful markers of aberrant behaviour. There are five separate studies which have looked at the use of the Conscientiousness Index (CI) in medical trainees.[1–3] All have shown that simple administrative data can be used to sensitively detect the outlier group with very low CI scores.
If we use these same principles along with a graph database and GNN, we predict that it will not be hard to detect aberrant behaviours amongst health professionals. While we acknowledge that correlation is not causation and that such an approach, while sensitive, will have the risk of producing false positives, we also note that MRAs and licensing bodies would not be likely to act on GNN flags and recommendations alone. Such markers would more likely be used as a filter to indicate professionals who may be in difficulty. This in turn also offers a more remedial and helpful approach: a phone call such as “is everything ok? do you need help with that?” is much more desirable than a notice to appear before the regulators.
We already know that physicians-at-risk are more likely to exhibit the following behaviours: more frequent than average change in location or regulatory region; prescribing habits, use of triplicates, use of investigations and imaging. All of these factors are now recognized. But there are almost certainly other factors such as changes in business arrangement numbers, association with other at-risk professionals, sub-specialty procedures of marginal value, use of PO boxes rather than street addresses. Google almost certainly knows some of these graph-linked associations. Why aren’t we looking for this?
References
- McLachlan JC, Finn G, Macnaughton J. The Conscientiousness Index: A Novel Tool to Explore Students’ Professionalism. Acad Med [Internet]. 2009 May [cited 2016 Aug 8];84(5):559–65. Available from: http://content.wkhealth.com/linkback/openurl?sid=WKPTLP:landingpage&an=00001888-200905000-00009
- Kelly M, O’Flynn S, McLachlan J, Sawdon MA. The clinical conscientiousness index: a valid tool for exploring professionalism in the clinical undergraduate setting. Acad Med [Internet]. 2012 Sep [cited 2016 Jul 10];87(9):1218–24. Available from: http://www.ncbi.nlm.nih.gov/pubmed/22836848
- Finn G, Sawdon M, Clipsham L, McLachlan J. Peer estimation of lack of professionalism correlates with low Conscientiousness Index scores. Med Educ [Internet]. Blackwell Publishing Ltd; 2009 Oct [cited 2016 Aug 8];43(10):960–7. Available from: http://doi.wiley.com/10.1111/j.1365-2923.2009.03453.x