
Background
![]()
The QuRE Project has developed some powerful and useful tools to address the problem of enhancing quality in referrals and consultations between healthcare providers in Alberta. There are over 3 million consultations and referrals each year in the province of Alberta alone. Simple in principle, this is a chain of events that is fragile, complex and often inefficient. The QuRE Project has been widely lauded and, more importantly, adopted in other provinces which attests to its appeal.
Its principles are well researched. It has generated some excellent dissemination and education tools, including the QuRE quick reference cards, workshops, online materials and virtual scenarios for learners to practise on.
 ==>
==> 
But how do we know they are making a difference?
A Balanced Approach to Evaluation
The QuRE Project is exploring a number of approaches to evaluating the impact of their educational interventions. These are both qualitative and quantitative.
As well as looking at improving the quality of the content in both requisitions and responses in the referral/consult process, we should also look at the processes that surround them. There are some sad examples (e.g. https://gregswings.ca/) in healthcare where patient safety and care have been compromised by systems issues. A brilliantly crafted consult does little good if it does not reach its intended destination.
And a brilliantly crafted workshop should be evaluated to see if it changes the behaviours, often well-established even if faulty, of busy healthcare providers. We need to do better than Kirkpatrick level 1 happiness surveys. There are over 3 million consultations per year in Alberta alone. This represents a unique opportunity to study whether an educational intervention has an effect on patient care.
Process Mining and the EMR
None of us really wants to complete more surveys. We should be making better use of workplace systems to explore how we act on every day clinical problems. The obvious tool to employ in this regard is the Electronic Medical Record (EMR) and related health information systems.
The EMR and its data have often been explored in the quest to improve patient care. Groups, such as CPCSSN and PLP, have made valuable contributions to the effectiveness of this approach. But researchers have often been frustrated that the needed data appears to be unavailable. This is particularly applicable to process mining, which would be a valuable technique in addressing the complex workflows of healthcare.
In the PiHPES (Topps, Ellaway, & Greer, 2019) and QURATIVE Projects, we have been assembling a suite of tools and approaches that promise to provide the foundation for a broader and more extensible approach to studying activity streams and workflows.
The Process of Consulting
In the QUality Referrals And Triage Information Velocity Enhancement (QURATIVE) project, we are seeking to explore the referral/consult requisition/response processes, as an important adjunct and contextual assessment around the quality of the referral content.
This was illustrated by our initial explorations of what is perceived about the referral process by the typical practitioner. This is much more complex than was realized. Such a complex chain is also fragile, which gives rise to some important patient safety issues.
Example Perspectives
The same task may be viewed quite differently, depending on the perspective of the viewer, as well as the context of the task. Let us take for example, the seemingly simple process of referring Mrs Jones to an orthopaedic surgeon for a hip replacement. When educators were first asked to consider the steps in this process, this process map is typical of the simplistic view of the steps needed:
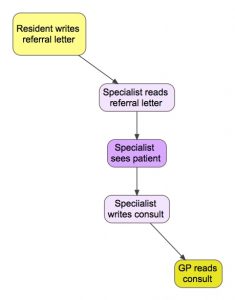
Fig 1: illustration of simplified steps in the referral/consultation process.
And when we asked Preceptors or Residents to describe this referral, it was again rendered as a very simple 3-6 step process. This is not imply that the Preceptors and Residents in this example are simple; each is more likely taking a much higher level view of the process.
Preceptor: (30,000 feet view)
- Ask PGY1 to refer Mrs Jones to Ortho for hip replacement
- Dr Shanks, Ortho, sends consult letter back to Preceptor
- Preceptor asks PGY2 to discuss ortho options with Mrs Jones
Resident: (10,000 feet view)
- Opens task from Preceptor
- Talks to Mrs Jones, for history and exam
- Sends referral letter to Medical Office Assistant (MOA)
- PGY2 (might be different) opens task from Preceptor
- Talks to Mrs Jones re options
- Discusses next steps with Preceptor
MOA: (5000 feet view)
- Opens task from PGY1 including letter
- Reformats letter and adds relevant data from EMR
- Sends to Ortho office
- Receives Consult letter from Ortho
- Sends letter to Preceptor
Process Engineer: (on LRS; 1000 feet view)
- Actor1 opens Chart (chartID as GUID)
- Actor1 creates Task (taskID as Int)
- Actor1 sends Task to Actor2 (as GUID)
- Actor2 opens Task (taskID as Int)
- Actor2 creates Appt (apptID as Int, chartID as GUID, timestamp)
- Actor2 opens Chart (chartID as GUID)
- Actor2 creates Referral (taskID as Int, chartID, specialtyID as Int)
- Actor2 sends Referral (taskID) to Actor3 (as GUID)
- Actor3 opens Task etc. etc. … …
- …
When we broke down a typical referral, it became more like 39 steps! And nobody died in this performance! (https://en.wikipedia.org/wiki/The_39_Steps_(play))

Fig 2: expanded concept map, illustrating a more detailed representation that more closely represents the steps and rework pathways in what is still a straightforward consultation.
Because this image does not scale well, for those who are interested, we have also provided this in a zoomable PDF format: https://olab.ca/wp-content/uploads/2019/10/QuRE-steps-in-referral-process2.pdf
Data flows
The data that is seen, and entered by the healthcare provider into the EMR is quite different from the process mining data that is captured in the activity streams or Change Tracking data in the underlying system.
This is more fully described in https://olab.ca/activity-data-vs-clinical-data-extraction-from-the-emr/
Table 1: To illustrate how different this is, we take a few steps from the above series and show, in pseudo-code statements, how these are recorded in the EMR and the Learning Record Store.
| EMR view | LRS view |
| Dr A opens Mrs Jones chart for review | {Actor1,View,Chart#:A437C886D15269935CD97A1FDB3F4306676AD1E4,…} |
| Dr A sends Task to PGY1 re ortho consult | {Actor1,Tasked,Actor2, Task#:6848d57b-a782-4d0e-8d76-1a934e82a25d} |
| PGY1 opens Task re Mrs Jones’ hips | {Actor2,View,Task#:6848d57b-a782-4d0e-8d76-1a934e82a25d, …} |
Table 2: This is an example of the JSON formatted statement that is actually retrieved from the LRS. There is not much that is human readable and no confidential content is exposed.
{

    "actor": {

        "mbox_sha1sum": "834FFFAF9307D88FDBC452D69C15429F4EBF1900",

        "objectType": "Agent"

    },

    "verb": {

        "id": "http://adlnet.gov/expapi/verbs/initialized",

        "display": {

            "en-US": "initialized"

        }

    },

    "object": {

        "id": "https://olab.ca/xapi-emr-profile#Initialized",

        "definition": {

            "name": {

                "en-US": "EMR openChart"

            },

            "description": {

                "en-US": "Open patient chart in the EMR"

            },

            "type": "http://adlnet.gov/expapi/activities/cmi.interaction",

            "interactionType": "sequencing"

        },

        "objectType": "Activity"

    }

}
Process mapping the activity streams
Even the more complex illustration seen in Figure 2 does not really capture all the steps in the process. This fragile chain of events in reality has even more loops, branches and cul-de-sacs. This is where processing mining software comes to our aid. There are a number of process mining and mapping tools available.
The LRS is valuable as an intermediary collator of activity streams and has abundant capacity to absorb such streams from a wide range of sources. The LRS also has useful reporting capabilities but these are not as yet really tuned for process mapping. But the LRS is designed to be integrated securely with other systems and to be able to generate triggered exports of filtered datasets.
As part of the QURATIVE Project, we are linking to the R statistical language platform, which has a multitude of open-source extensions. In particular, we will make use of bupaR (http://bupar.net/), a process mining library. This allows us to generate a number of data-driven representations of what is actually happening in any given consultation process.
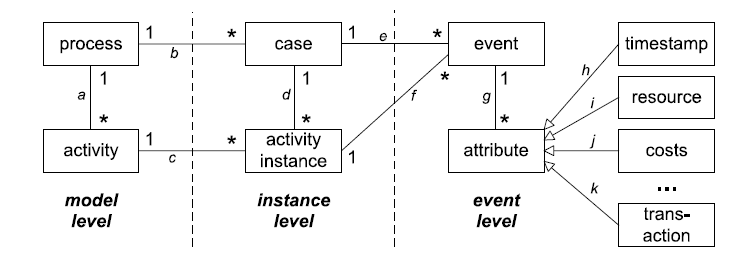
The Event Data Model
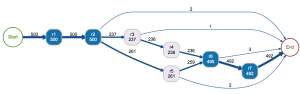
For example, we can generate an accurate model of the events or activities and the paths between them:
Transactional Life Cycle
Social Network Analysis
There is an interesting parallel between the narrative pathways enabled by OLab4 and OpenLabyrinth, which are educational research tools that support complex branching pathways, and the Handover-of-work network, as supported by the bupaR library.
Such a method of depicting the transaction of tasks in a social network graph may be quite powerful as a tool for analyzing the complex referral pathways in the QURATIVE project.
Duration-based Process Map
In particular for the QURATIVE Project, we are interested in the duration of the various steps in a process, as compared to the frequency.
patients %>%
    process_map(performance(median, "days"))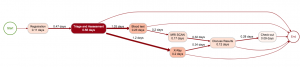
References
Topps, D., Ellaway, R., & Greer, G. (2019). PiHPES Project: broadened perspectives on learning analytics. Calgary. https://doi.org/https://doi.org/10.5683/SP2/VDGGG3
Janssenswillen, G., Depaire, B., Swennen, M., Jans, M., & Vanhoof, K. (2019). bupaR: Enabling reproducible business process analysis. Knowledge-Based Systems, 163, 927-930.
This technical report now published at:
Topps, D., Fisher, B., Wirun, C., Moores, D., Wong, A., & Ellaway, R. (2019). QuRE and Process Mining (V1 ed.). Calgary, AB, Canada: Scholars Portal Dataverse. https://doi.org/doi:10.5683/SP2/XTGIWP